
Artificial intelligence is no longer a futuristic luxury reserved for tech giants — it has become a practical, accessible tool that small and medium businesses use every day to reclaim their most valuable resource: time. From answering customer enquiries instantly to qualifying leads and automating repetitive admin, AI automation is quietly transforming how ambitious businesses operate. In this guide we explore exactly how AI automation saves businesses hours every week and how you can start putting it to work.
The Hidden Cost of Manual Work
Every business is quietly losing hours to repetitive, low-value tasks. Manually replying to the same customer enquiries, copying data between tools, qualifying leads, scheduling appointments and chasing follow-ups all consume time that could be spent growing the business. Individually these tasks seem small, but together they add up to days of lost productivity every single month.
This hidden cost is especially damaging for small teams, where every hour matters. The opportunity cost is enormous: time spent on busywork is time not spent serving customers, closing deals or improving your product.
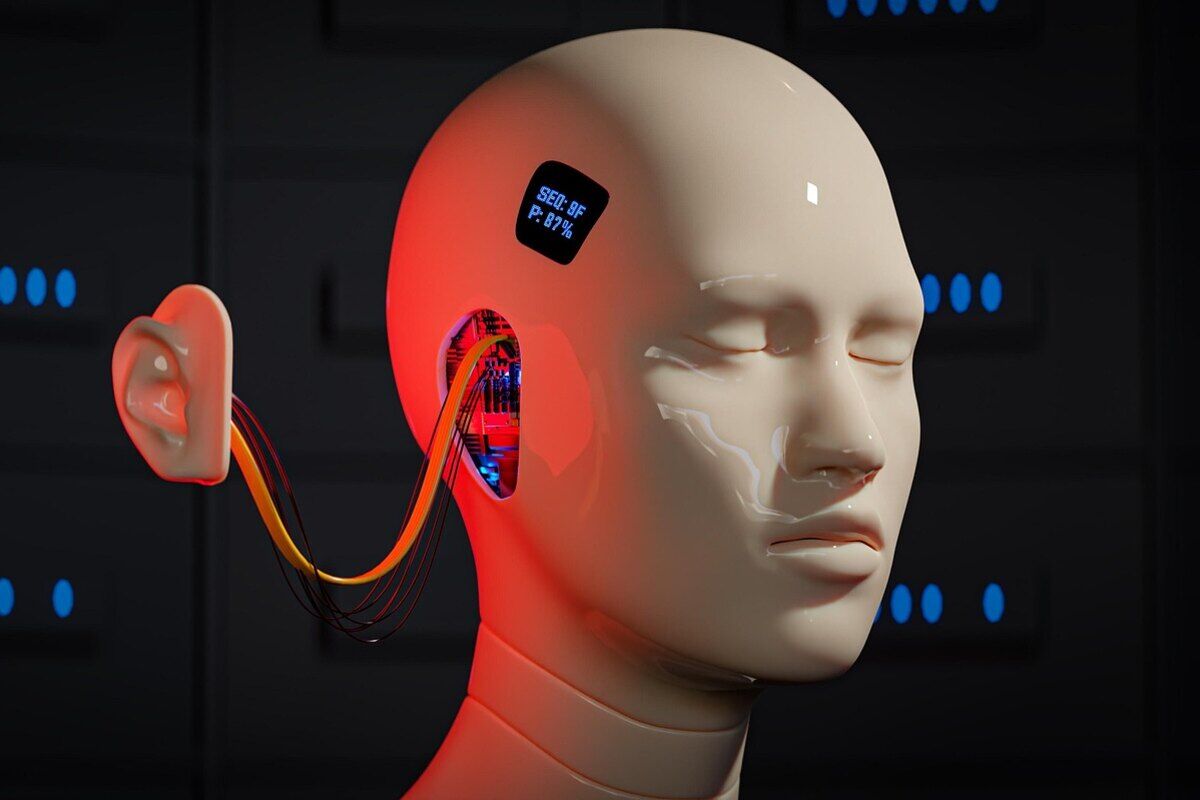
What AI Automation Actually Is
AI automation combines artificial intelligence with workflow automation to handle tasks that previously required human attention. Rather than replacing your team, it removes the repetitive, draining work so your people can focus on what humans do best — building relationships, solving complex problems and being creative.
Modern AI tools are remarkably accessible. You no longer need a team of engineers or a huge budget to benefit. With the right setup, even a small business can deploy intelligent automation that works around the clock.
Where AI Automation Helps Most
AI automation delivers the biggest returns when applied to high-volume, repetitive tasks that follow predictable patterns. These are exactly the tasks that drain your team’s time without requiring deep human judgment.
Here are the areas where businesses see the fastest, most meaningful impact.
- AI chatbots that answer customer questions instantly, day and night
- Automatic lead qualification and routing to the right team member
- Smart follow-up email and message sequences that nurture prospects
- Data entry and CRM updates handled automatically
- Content drafting, scheduling and repurposing at scale
- Appointment booking and reminders without manual coordination
Instant Customer Response With AI Chatbots
One of the most powerful and immediate uses of AI is the intelligent chatbot. Customers today expect fast answers, and a delay of even a few hours can lose you the sale. An AI chatbot greets every visitor instantly, answers common questions, qualifies their needs and captures their details — all without your team lifting a finger.
The best chatbots feel genuinely helpful rather than robotic, guiding customers towards the right solution and seamlessly handing off to a human when needed. This combination of speed and quality dramatically improves both customer satisfaction and conversion rates.
Automating Lead Qualification and Follow-Up
Not every lead is ready to buy, and manually sorting through enquiries wastes valuable sales time. AI automation can instantly qualify leads based on their responses and behaviour, prioritising the hottest prospects and nurturing the rest with automated, personalised follow-up sequences.
This ensures no lead ever falls through the cracks while your team focuses its energy on the prospects most likely to convert. The result is a more efficient sales process and a higher close rate.

Start Small, Then Scale Smart
The biggest mistake businesses make with AI is trying to automate everything at once. The smarter approach is to identify your single most repetitive, time-consuming task, automate it well, and reinvest the time saved into higher-value work. Once that automation is delivering results, you expand to the next opportunity.
This incremental approach keeps things manageable, builds confidence and ensures each automation delivers real value before you move on. Over the course of a year, the compounding effect of these time savings is genuinely transformative.
The Competitive Advantage of Automation
Businesses that embrace AI automation gain a durable competitive advantage. They respond to customers faster, operate more efficiently, scale without proportionally increasing costs, and free their best people to focus on growth. In an increasingly competitive market, these advantages compound over time.
The businesses that thrive in the years ahead will not necessarily be the biggest — they will be the ones that work smartest. AI automation is one of the most accessible ways to start working smarter today.
Real-World Examples of AI Automation in Action
The impact of AI automation is best understood through real examples. A local service business uses an AI chatbot to book appointments automatically, eliminating hours of phone tag each week. An ecommerce store uses automated email sequences to recover abandoned carts and welcome new customers without manual effort. A consultancy uses AI to qualify and route enquiries instantly, ensuring its team only speaks to serious prospects.
Across every industry, the pattern is the same: tasks that once consumed hours of human time are handled instantly and reliably by intelligent automation. The time reclaimed is reinvested into the work that actually grows the business, creating a virtuous cycle of efficiency and growth.
Integrating AI With Your Existing Tools
One of the most appealing aspects of modern AI automation is how seamlessly it integrates with the tools you already use. Whether it is your CRM, email platform, calendar, website or messaging apps, AI automation can connect them into a smooth, coordinated workflow that eliminates manual handoffs and data entry.
This integration is where the magic happens — information flows automatically between systems, customers receive timely and consistent communication, and your team gains a single, reliable source of truth. The result is an operation that runs more smoothly with far less manual effort.

Getting Started With AI Automation the Right Way
Beginning your AI automation journey does not require a massive budget or technical expertise — it requires a clear plan. Start by mapping out your daily and weekly tasks, then identify which ones are repetitive, time-consuming and rule-based. These are your prime candidates for automation, offering the fastest and most meaningful returns on your investment.
Next, choose one high-impact area and implement automation thoughtfully, measuring the time and effort it saves. Resist the temptation to automate everything at once; a focused, well-executed automation delivers far more value than a dozen half-finished experiments. Once it is working reliably, move on to the next opportunity.
Partnering with an experienced automation specialist can dramatically accelerate this process. The right expert helps you identify the highest-value opportunities, select the appropriate tools and integrate everything seamlessly into your existing workflow — ensuring you capture the full benefits of AI automation without the trial and error of going it alone.
The Future of AI for Small Businesses
The pace of progress in artificial intelligence means that the tools available today are only the beginning. AI is becoming more capable, more affordable and easier to use with every passing month, putting capabilities that were once the exclusive domain of large enterprises within reach of even the smallest businesses.
Forward-thinking business owners are positioning themselves to benefit from this wave by building the foundations now — clean data, connected systems and a culture of continuous improvement. Those who embrace automation early will be best placed to take advantage of each new advance as it arrives.
Rather than fearing this change, smart businesses are embracing it as a tremendous opportunity. AI automation levels the playing field, allowing small and medium businesses to deliver the speed, responsiveness and efficiency that customers increasingly expect. The businesses that adapt will not just survive but thrive in the years ahead.
Balancing Automation With the Human Touch
While automation delivers remarkable efficiency, the most successful businesses know when to keep things human. Automation should handle the repetitive, predictable tasks while preserving genuine human connection for the moments that matter most — complex problems, sensitive conversations and relationship-building that customers truly value.
The goal is not to remove people from the equation but to free them to do their best, most meaningful work. When automation and human expertise are thoughtfully combined, businesses deliver both the speed customers expect and the warmth that earns their loyalty, creating an experience that feels effortless yet genuinely personal.
Key Takeaways
- Repetitive manual tasks silently cost businesses days of productivity each month
- AI automation augments your team rather than replacing it
- Chatbots and automated follow-up capture leads that would otherwise be lost
- Start with one high-impact task, then scale automation gradually
- Smart automation creates a lasting competitive advantage
Frequently Asked Questions
Is AI automation only for large companies?
Not at all. Modern AI tools are highly accessible and affordable, making them especially valuable for small and medium businesses that need to do more with limited resources.
Will AI automation replace my employees?
AI automation is best used to remove repetitive busywork so your team can focus on high-value, human-centred tasks. It augments your people rather than replacing them.
What is the easiest place to start with AI automation?
Most businesses see quick wins by starting with an AI chatbot for instant customer responses or by automating lead qualification and follow-up.
Partner With The Creative Minds
At The Creative Minds, we help ambitious brands dream big, think big and achieve big. Whether you need a high-converting website, a results-driven marketing engine or a complete digital transformation, our team turns strategy into measurable growth. Get in touch for a free consultation and let us build something remarkable together.